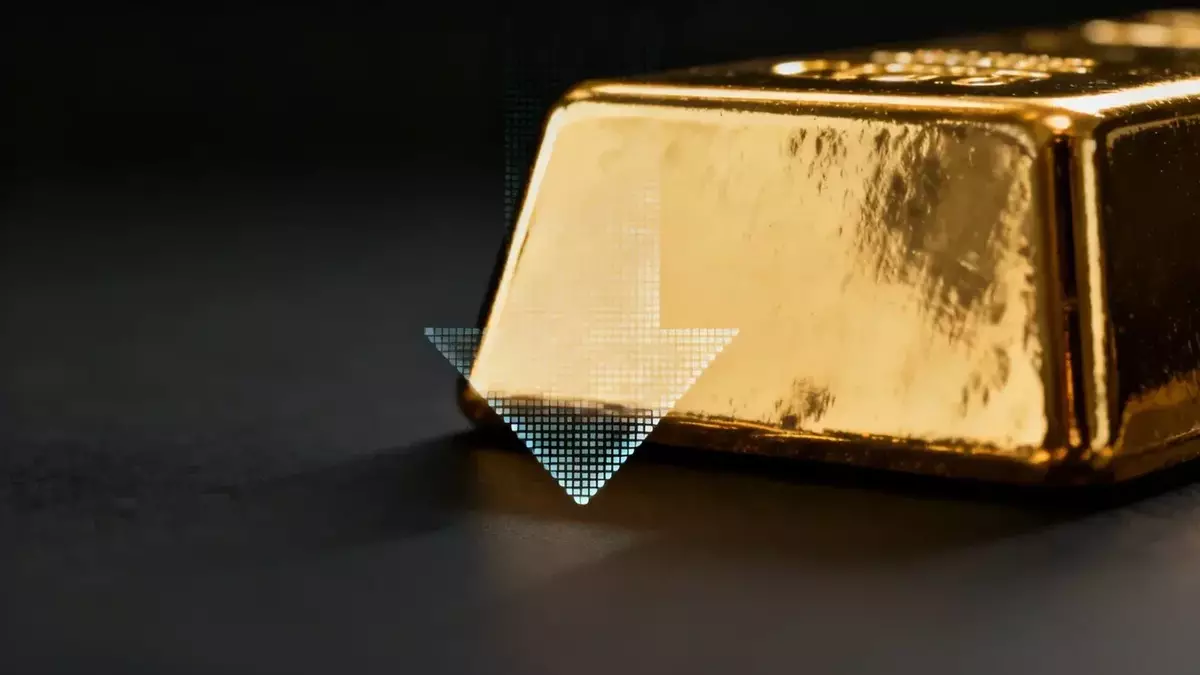
Gold's Rally Reverses as Sanctions and Hawkish Fed Minutes Trigger Steep Drop
Published on 07/08/2026 at 13:44 | Redaktion boerse-global.de
Gold’s brief safe-haven surge has evaporated after a one-two punch from Washington and the Federal Reserve. The metal slid to $4,064.10 per ounce in recent trading, shedding roughly 1.3% on the day and extending its year-to-date loss to more than 6%. Just days earlier, bullion had been trading above $4,120, buoyed by a direct military confrontation between the United States and Iran.
The conflicting forces have left the market grappling with a complex picture: an initial flight to safety gave way to renewed selling as investors weighed a fresh wave of US sanctions against Tehran and a remarkably hawkish set of Federal Reserve minutes.
Geopolitical heat turns to headwind
The catalyst for the initial rally was a dramatic escalation in the Gulf. The US Central Command reported strikes on roughly 80 Iranian targets, while Iran retaliated with rocket attacks on American military installations in Bahrain and Kuwait. That sent gold sharply higher, with the metal posting a weekly gain of 2.71%.
But the geopolitical tailwind quickly shifted. Washington revoked a key sanctions waiver that had allowed some countries to continue importing Iranian oil, banning all remaining transactions from July 17. The move pushed Brent crude briefly above $75 a barrel and, more importantly for gold, strengthened the US dollar and pushed bond yields higher. The yield on the 10-year Treasury note settled around 4.45%, intensifying the opportunity cost of holding a non-yielding asset like gold.
Should investors sell immediately? Or is it worth buying Gold?
Fed Chair Warsh draws a line under rate-cut hopes
The downbeat tone was reinforced by the release of the Federal Reserve’s June meeting minutes, the first under new Chair Kevin Warsh. The central bank left its benchmark rate unchanged at a maximum of 3.75%, but the accompanying projections delivered a shock.
Warsh removed any reference to future rate cuts from the statement entirely. The updated dot plot showed half of policymakers now expect rates to be higher by the end of 2026, with the first easing not on the table until 2027. In an unusual move, Warsh himself refrained from submitting a personal rate projection — the first time in 14 years a Fed chair has declined to plot a dot. Markets are currently pricing a 56% chance of a rate hike at the September meeting.
The hawkish pivot has prompted a sharp recalibration across Wall Street. Goldman Sachs slashed its year-end 2026 gold target to $4,900, citing the delayed easing cycle. J.P. Morgan, while still bullish, expects prices around $5,000 in the fourth quarter.
Central banks stay the course, but ETF investors bail
Beneath the price volatility, the fundamental tug-of-war between long-term institutional buyers and short-term speculative flows continues. China’s central bank added to its gold reserves for the twentieth consecutive month in June, bringing its total holdings to just over 75 million ounces as part of a broad de-dollarization strategy.
That steady official-sector demand, however, is being overwhelmed by retreating ETF investors. Physical gold-backed exchange-traded funds saw outflows of 16 tonnes in the previous month, a trend that has accelerated in recent weeks. The weakness in the US labor market — a paltry 57,000 new jobs added last month — has done little to revive interest, as traders focus instead on the rising rate environment.
Gold at a turning point? This analysis reveals what investors need to know now.
Technical breakdown threatens deeper losses
The selloff has inflicted serious damage on the chart structure. A head-and-shoulders pattern that had been forming on the weekly chart was confirmed when gold broke below the neckline at $4,200 — a level now acting as overhead resistance.
The distance to the 50-day moving average has widened to more than 7%, and a sustained weekly close below $4,200 activates a measured target near $2,575. Analysts note that a swift recovery above $4,400 would negate the bearish setup, but the burden of proof currently rests with the bulls.
Ad
Gold Stock: New Analysis - 8 July
Fresh Gold information released. What's the impact for investors? Our latest independent report examines recent figures and market trends.
Disclaimer regarding our articles: No investment advice, no buy or sell recommendation. Information on prices, companies, and markets is provided without guarantee; changes are possible at any time. Stock market transactions can lead to substantial losses. Our articles are created and reviewed in whole or in part automatically with the support of AI.