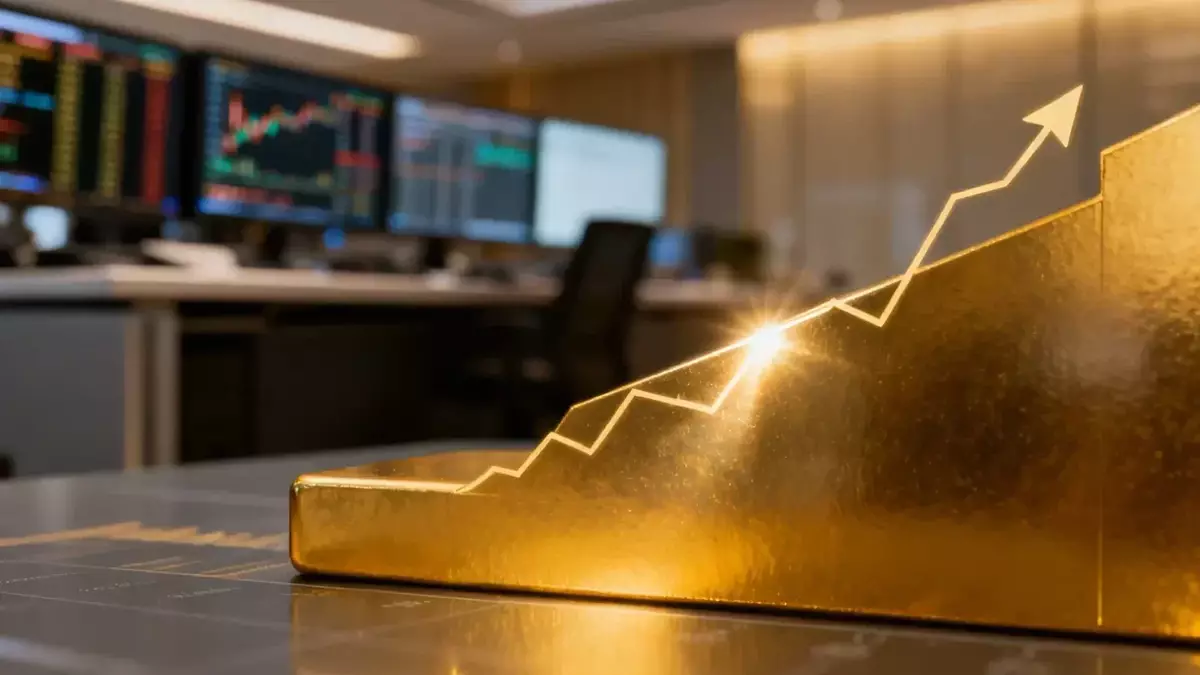
Gold's Conflicting Signals: Record Central Bank Hoarding Meets a Hawkish Fed Ceiling
Published on 08/01/2026 at 14:02 | Redaktion boerse-global.de
Gold finished Friday at $4,098.60 per ounce, down 1.54 percent on the day, after sellers snuffed out an attempt to reclaim the $4,100 level. The pullback, however, masks a more layered picture: the metal still posted a weekly gain of 1.06 percent and a monthly advance of 1.35 percent, while a fresh report from the World Gold Council revealed central banks just completed their most aggressive second-quarter buying spree on record.
A Divided Fed Complicates the Calculus
The Federal Reserve left its benchmark rate unchanged at 3.5 to 3.75 percent following its two-day meeting this week, though the decision was far from unanimous. The vote came in at 9 to 3, with three members pushing for a 25-basis-point hike. Fed Chair Kevin Warsh has held firm on his restrictive stance, arguing that disinflation remains too tentative to justify easing. June's headline inflation cooled to 3.5 percent, but the core PCE index — the Fed's preferred gauge — still sits at 3.3 percent, with the overall index at 3.7 percent.
The "higher-for-longer" posture raises the opportunity cost of holding a non-yielding asset like gold. Yet market pricing suggests the tightening bias may be softening: odds of a September rate increase, tracked by the CME FedWatch Tool, have slipped from above 80 percent to roughly 63 to 65 percent. Economic data offers mixed support for the hawks — GDP grew at 1.5 percent in the second quarter, down from 2.1 percent in the first.
The dollar added to gold's Friday woes, recovering about 0.5 percent after a sharp 2.4 percent decline the prior session. Other precious metals followed gold lower, with silver, platinum, and palladium all posting losses in the low double-digit percentage range.
Should investors sell immediately? Or is it worth buying Gold?
Central Banks Rewrite the Demand Playbook
While price action has been choppy, the structural picture tells a different story. Central banks purchased 289 tonnes of gold in the second quarter — a 62 percent jump year over year and the strongest Q2 figure ever recorded by the World Gold Council. Global gold demand held steady at 1,269 tonnes for the quarter, while first-half demand reached 2,522 tonnes, up 2 percent and representing a record $380 billion in value.
A notable revision complicates the narrative: first-quarter central bank purchases were retroactively cut from an initially reported 244 tonnes to just 57 tonnes — an adjustment the Council itself described as "significant." The correction suggests official-sector buying may be lumpier than headline numbers imply, even as the long-term trend remains intact.
Gold's share of global currency reserves now stands at 27 percent, overtaking US Treasuries at 22 percent for the first time. Central banks collectively hold more than 36,000 tonnes. Poland led recent buyers with over 100 tonnes, followed by China, India, Turkey, Kazakhstan, and Brazil. Geopolitical tensions in the Middle East and Venezuela, along with concerns about Western sovereign debt and dollar diversification, continue to drive official demand.
The private sector is joining in as well. Stablecoin issuer Tether added 14 tonnes in the quarter, bringing its hoard to 146 tonnes worth $18.8 billion — making it the largest known gold holder outside of banks and governments.
The Other Side of the Ledger
Not all demand channels are thriving. Jewelry consumption fell 17 percent to its lowest level since the pandemic began, while gold-backed ETFs saw net outflows of 45 tonnes. India, traditionally a major buyer, reported a 6 percent drop in demand to 131.4 tonnes — though the value of that demand rose 50 percent due to elevated price levels. The average gold price in the second quarter came in at $4,506.30 per ounce, roughly 8 percent below the first quarter's average.
Chart Levels That Matter
Technically, gold remains in a tight consolidation band. The metal sits 27.16 percent below its 52-week high of $5,626.80 from January 2026, and 2.41 percent beneath its 50-day moving average of $4,199.84. The 200-day average of $4,541.41 looms 9.75 percent overhead, underscoring how far the market has retreated from its long-term trend.
The RSI reads 48.6 — neutral territory. A falling wedge pattern has been forming on the daily chart for weeks, bounded by support near $3,850 and heavy resistance around $4,100. Market watchers have flagged specific levels to monitor: resistance at $4,066.30 (the 20-day SMA) and $4,090.20, with critical support at $3,995.30. A break below that floor would open the door toward $3,880.
Gold at a turning point? This analysis reveals what investors need to know now.
Analyst Fred Hickey views the current consolidation as a potential base-building phase rather than the start of a sustained downtrend, pointing to persistent Chinese demand and slowing ETF outflows as supportive factors.
NFP Week Looms
The coming trading week carries heavy weight for direction. Monday brings the ISM manufacturing index, followed by JOLTS job openings on Tuesday. Wednesday features the ADP employment report and ISM services data, with Friday's non-farm payrolls closing the week. A weaker-than-expected labor report could intensify pressure on the Fed to reconsider its stance — exactly the trigger gold bulls are waiting for.
Forecasts diverge sharply across major banks. J.P. Morgan maintains a year-end target of $6,000 provided a clear rate-cutting path emerges, while HSBC trimmed its 2026 projection to $4,560 in July.
For now, the $3,995.30 level remains the pivotal battleground. Hold it, and a return toward $4,100 stays in play. Lose it, and $3,880 becomes the next stop — even as central banks quietly keep building their hoards beneath the surface.
Ad
Gold Stock: New Analysis - 1 August
Fresh Gold information released. What's the impact for investors? Our latest independent report examines recent figures and market trends.
Disclaimer regarding our articles: No investment advice, no buy or sell recommendation. Information on prices, companies, and markets is provided without guarantee; changes are possible at any time. Stock market transactions can lead to substantial losses. Our articles are created and reviewed in whole or in part automatically with the support of AI.