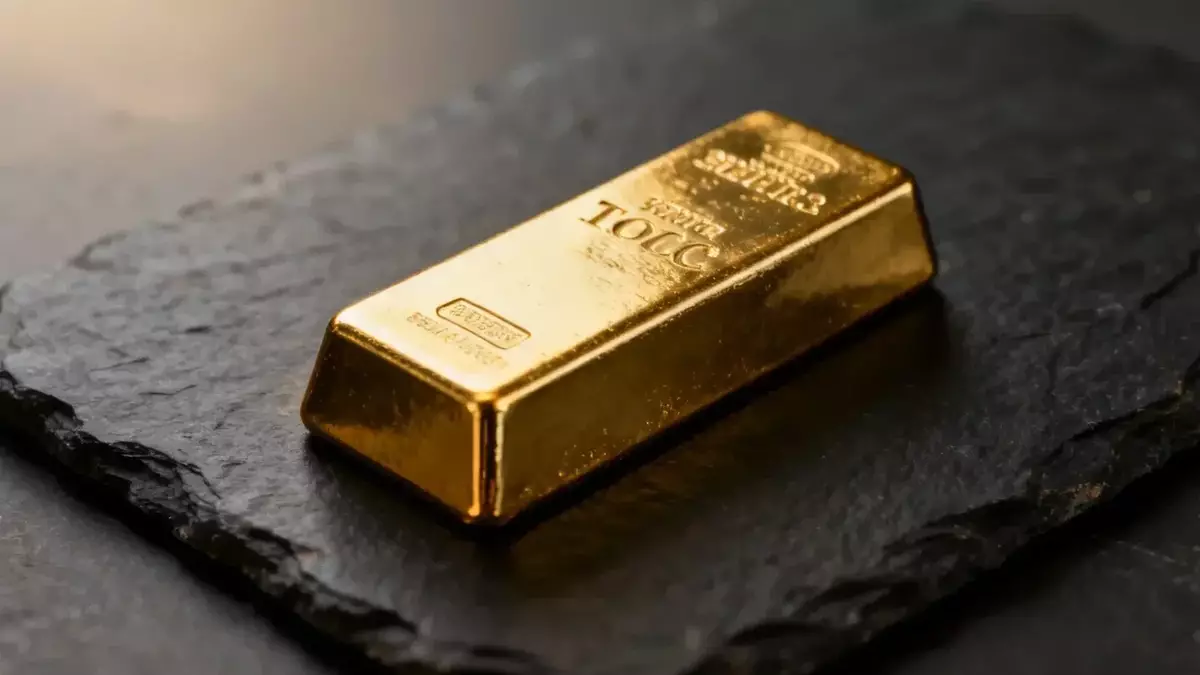
Gold's Hormuz Rally Masks a Deeper Technical Battle
Published on 08/05/2026 at 20:12 | Redaktion boerse-global.de
The precious metals complex is staging a powerful comeback while energy markets head in the opposite direction, as traders weigh the prospect of a diplomatic breakthrough in the Strait of Hormuz against a backdrop of shifting rate expectations.
Gold jumped 3.88 percent on Wednesday to $4,294.60, climbing from Tuesday's close of $4,134.20. The move extends the metal's weekly gain to 4.09 percent, though the longer-term picture remains more complicated than the daily chart suggests.
A Diplomatic Spark, A Technical Ceiling
The catalyst for the surge came from Washington, where President Trump signaled that an agreement to reopen the strategic waterway could be reached as soon as Wednesday. Iran has been holding direct talks with Oman, and certain European nations have been permitted to assist with mine-clearing operations. Yet Iranian officials have been quick to clarify that active negotiations with the United States are not taking place — only discussions with Oman regarding the Strait.
That diplomatic ambiguity cuts both ways for gold. A genuine resolution would likely sap the metal's geopolitical risk premium, while continued uncertainty could keep safe-haven flows intact. For now, traders are choosing to focus on the constructive headlines.
Should investors sell immediately? Or is it worth buying Gold?
The rally has also been supported by a softer dollar, with the dollar index slipping below the 100-point threshold as US Treasury yields retreat. That combination of a weaker greenback and falling real yields has historically been fertile ground for bullion.
The Technical Reality Check
Despite the impressive daily gain, gold remains in recovery mode rather than entering a new bull phase. The metal is still trading roughly 23 percent below its all-time high of $5,586.20, set in late January, after a sharp correction that followed. It also sits about five percent under its 200-day moving average of $4,532.66 — a level that would need to be reclaimed before technicians would call this anything more than a rebound.
The relative strength index at 61.5 signals momentum but stops short of flashing overbought conditions. A commodities strategist at Bannockburn Capital Markets cautions against chasing prices near record levels in hopes of further gains, calling that approach a difficult strategy.
Attention now turns to Friday's July jobs report, which could influence the Federal Reserve's thinking on rate moves following its September meeting. The combination of geopolitical diplomacy and labor market data is likely to keep volatility elevated in the sessions ahead.
Silver Steals the Show
Silver outperformed its larger counterpart on Wednesday, climbing more than three percent and breaking above the psychologically significant $60 level after trading around $61.50. The gold-silver ratio slipped from 68.18 to 67.64, reflecting silver's relative strength.
Technicians are now watching the 50-day moving average near $63 and the 200-day average around $70 as the next hurdles. Should silver clear those levels, some market observers see scope for a push toward $70 or even $80. Notably, mining equities have been slow to join the rally — heavyweights like Barrick, Newmont, and Agnico Eagle Mines have struggled in recent months, as have silver producers Fresnillo, Hecla Mining, and Pan American Silver. That divergence between metal prices and mining stocks is likely to remain a point of focus.
Energy Markets Feel the Diplomatic Chill
While metals celebrate, crude oil is feeling the pressure of easing geopolitical tensions. WTI slipped about 0.8 percent to roughly $75 per barrel, following losses of more than five percent in both major benchmarks the previous day. Slightly bearish inventory data added to the downward pressure.
Brent has shown more resilience, trading at $79.40, up 0.90 percent from Wednesday's close of $78.69. A reported attack by Yemeni Houthi rebels on a Saudi vessel in the Red Sea briefly injected fresh uncertainty into the market. But the weekly picture tells a starker story: Brent has lost roughly 12.3 percent over seven days, even as it remains up more than 30 percent year-to-date and about ten percent higher on a monthly basis.
The contract currently trades about six percent below its 50-day moving average of $84.48, with an RSI of 42.6 suggesting weakness without reaching oversold territory. Looking further out, analysts see a wide trading range of $65 to $120 for 2027 and 2028, depending on how geopolitics and OPEC+ policy evolve.
Gold at a turning point? This analysis reveals what investors need to know now.
Coffee's Separate Path
Coffee markets are marching to their own drummer, driven by crop prospects rather than diplomacy or monetary policy. Prices rose 0.62 percent to $309.60, recovering from a weak stretch that has left the commodity down 14.93 percent on the month and 11.23 percent year-to-date.
The September 2026 Arabica contract gained about one percent, while London Robusta for the same month advanced roughly 1.8 percent. Brazil is heading toward what several research houses describe as a record harvest, which could meaningfully expand supply in the medium term. With an RSI of 47.1 and prices hovering about four percent above the 50-day average, the market appears balanced between overbought and oversold conditions.
What to Watch
The trajectory of the Iran talks remains the dominant force across commodity markets. A concrete transitional agreement to reopen the Strait of Hormuz would likely push WTI and Brent lower, while a collapse in negotiations could quickly reverse the recent slide. For gold and silver, dollar dynamics and rate expectations remain the central variables — and the distance from the 200-day average serves as a reminder that this rally has yet to be confirmed on a broader basis.
The coming days will reveal whether the current split between safe havens and energy markets persists, or whether a genuine diplomatic resolution in the Middle East ultimately spills over into the precious metals complex as well.
Ad
Gold Stock: New Analysis - 5 August
Fresh Gold information released. What's the impact for investors? Our latest independent report examines recent figures and market trends.